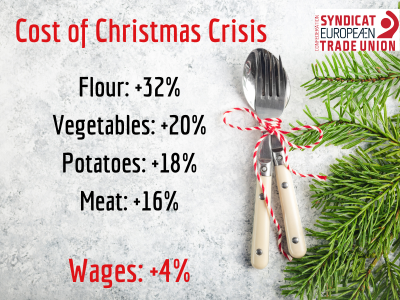
Families will be forced to cut back on Christmas dinner this year as a result of food prices rising up to seven times faster than wages, an analysis by the ETUC has found.
Food prices, which is the second highest contributor to inflation after energy, have increased by a huge 18% across the European Union since last winter.
The prices of items needed to cook a Christmas dinner have, on average across the EU, increased by:
Meat: +16.4%
Vegetables: +20.2%
Potatoes: +17.6%
Flour: +32.1
By comparison, nominal wages are expected to have increased by 4,4% in the EU by the end of this year, meaning food prices are rising more than four times faster than wages.
Families face the sharpest increase in Slovenia, where food prices are rising 7,6 times quicker than wages, followed by Sweden (6.4), Spain (5.4), and Malta (4.7).
That comes on top of the increasingly unaffordable cost of cooking food, with low paid workers now spending over a month’s wages on energy bills in some countries.
The ETUC are calling on the EU Council and EU and national politicians to make it their new year’s resolution to include:
- Take action to prevent speculation on food prices, including through price caps and taxes on excess profits;
- Payments targeted for people struggling to put food on the table and afford their energy bills;
- Support pay rises to meet the increase in the cost of living.
The ETUC is specifically calling for the EU Council meeting this week to agree European anti-crisis measures to safeguard production, jobs and incomes across all sectors.
Commenting on the findings, which come out in a week of strikes and protests including in Italy, UK and Belgium, ETUC General Secretary Esther Lynch said:
“Many families worry every year about being able to afford presents but just buying the ingredients for and cooking a Christmas dinner will be difficult this year.
“Christmas is going to be incredibly tough for millions of people because of rises in the price of food and fuel due to the war in Ukraine, corporate profiteering and speculation.
“These figures make clear it’s grinch-like CEOs not struggling workers and their families who are driving inflation.
“Politicians should make it a new year’s resolution to end excessive profiteering and price speculation on food and energy, which are making major contributions to the inflation crisis causing misery this Christmas.”
Notes
ETUC six-point plan to end the cost of living crisis: https://www.etuc.org/en/document/end-cost-living-crisis-increase-wages-tax-profits
Belgian unions have a national demonstration – gathering at 10am at Gare du Nord - on 16 December as EU leaders meet in Brussels for the European Council https://www.fgtb.be/sites/fgtb/files/2022-12/22B399F%20Annexe%20Tract%2016%2012%202022.pdf
Table showing increase in price of food between October 2021 and October 2022, as well as the increase in nominal compensation per employee between 2021 and 2022.
Source: Prices from Eurostat HICP. Wages from European Commission Ameco database.
|
Country |
Meat |
Vegetables |
Potatoes |
Bread & cereals |
All food |
Wages |
Food price increases vs wage increases |
|
Belgium |
12,3 |
13,4 |
14,2 |
14,9 |
13,4 |
6,4 |
2,1 x faster |
|
Bulgaria |
25,2 |
18,2 |
35,3 |
26,9 |
27,4 |
15,2 |
1,8 |
|
Czechia |
26,7 |
24,0 |
26,7 |
29,1 |
26,7 |
7,7 |
3,5 |
|
Denmark |
18,0 |
11,0 |
9,8 |
16,5 |
16,5 |
3,3 |
5 |
|
Estonia |
27,8 |
26,7 |
12,2 |
27,8 |
28,9 |
9,7 |
3 |
|
Ireland |
13,1 |
5,4 |
3,1 |
11,9 |
10,9 |
3,5 |
3,1 |
|
Greece |
17,2 |
13,1 |
25,0 |
19,4 |
15,1 |
5,1 |
2,9 |
|
Spain |
12,5 |
21,2 |
19,0 |
19,0 |
15,8 |
2,9 |
5,4 |
|
France |
12,4 |
22,1 |
7,8 |
11,2 |
13,2 |
4,6 |
2,9 |
|
Croatia |
18,1 |
18,2 |
15,9 |
28,2 |
20,5 |
8,0 |
2,6 |
|
Italy |
10,4 |
20,2 |
12,3 |
15,9 |
13,8 |
4,5 |
3,1 |
|
Cyprus |
15,6 |
18,9 |
60,8 |
14,2 |
12,5 |
4,8 |
2,7 |
|
Latvia |
25,2 |
22,7 |
15,0 |
35,5 |
30,0 |
10,9 |
2,8 |
|
Lithuania |
27,0 |
32,1 |
12,6 |
35,4 |
33,3 |
10,9 |
3,1 |
|
Luxembourg |
11,7 |
13,2 |
8,8 |
12,5 |
11,0 |
5,1 |
2,2 |
|
Hungary |
34,6 |
39,7 |
45,1 |
60,1 |
45,2 |
14,5 |
3,1 |
|
Malta |
16,3 |
21,3 |
4,4 |
15,7 |
15,1 |
3,2 |
4,7 |
|
Netherlands |
17,3 |
10,7 |
6,1 |
11,3 |
14,0 |
3,3 |
4,2 |
|
Austria |
15,5 |
14,8 |
15,3 |
14,4 |
14,5 |
4,2 |
3,5 |
|
Poland |
25,4 |
17,2 |
16,2 |
22,5 |
21,8 |
10,9 |
2 |
|
Portugal |
22,1 |
26,2 |
27,3 |
18,0 |
19,2 |
4,6 |
4,2 |
|
Romania |
15,8 |
24,7 |
38,8 |
26,5 |
21,8 |
8,2 |
2,6 |
|
Slovenia |
17,1 |
16,4 |
8,3 |
18,9 |
17,9 |
2,5 |
7,6 |
|
Slovakia |
27,6 |
25,5 |
31,4 |
27,5 |
26,8 |
7,6 |
3,5 |
|
Finland |
22,1 |
15,4 |
13,2 |
17,1 |
15,9 |
3,5 |
4,5 |
|
Sweden |
17,1 |
17,0 |
24,1 |
17,7 |
18,0 |
2,8 |
6,4 |

